Monitoring of sewerage network - WOZ Goleniów
Hardware: PC server
Control stations: 20x MT - 202
Implementation: Robert Zabrocki, https://zabrotzki.com
Date of commission: 5/2017
Creating a website that will make data from the sewerage network available through WWW browsers and using Google maps. Programming and installation of InVentia telemetry modules at individual pumping stations.

Creating a system that sends SMS to operators after an alarm occurs. Phone numbers and assignment of alarms to be sent is on the monitoring side. Implementation of a trending system allowing an overview of historical measurement values (levels, currents, flows, etc.). The graph presenting the data allows to change the time presented on X-axis according to the user's needs. Implementation of a reporting system showing the status of the whole pump station. The report contains the following data: current level, pump flows, pump operation confirmation, pump faults, power failure, hydrostatic probe failure, dry running, overflow. The graph on which the data is presented allows the time presented on X-axis to be changed depending on the user's needs.

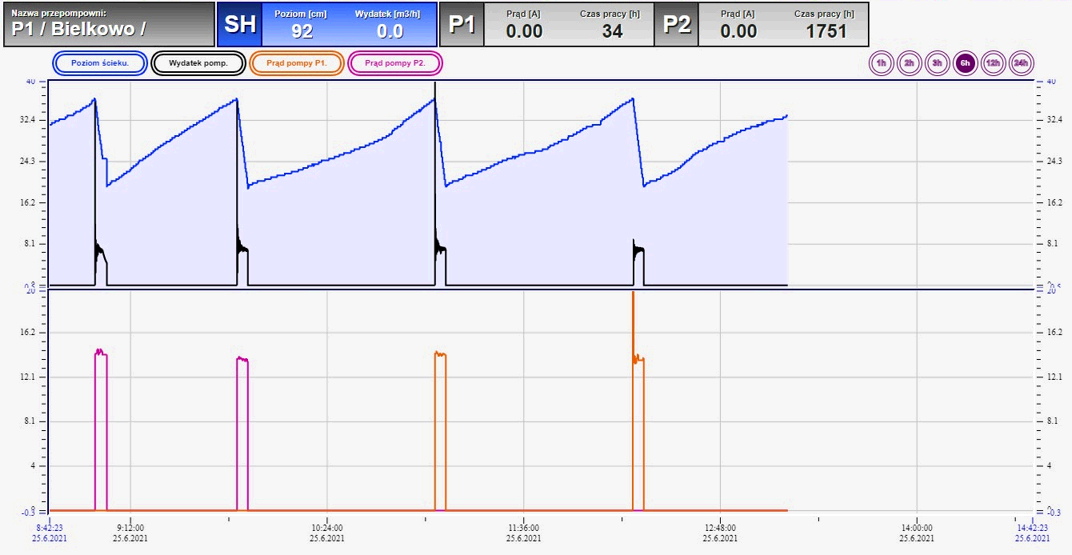
The PROMOTIC SCADA system from the Czech company MICROSYS was used to create the web service. It allows to create visualizations supporting WWW access. Google maps were used to better visualize the location of individual pump stations. Labels with object identifiers were placed on the map. The color of the label informs the operator about the state of the object. Grey means that nothing is happening. Green means that at least one pump is working. Red indicates a fault. The central element of the synoptic screen is a graph showing: the current wastewater level, the flows of all pumps and the pumping rate. In addition to the graph, the screen also displays labels that show alarms and basic information such as: Pump operating time, number of pump starts, activation level, deactivation level.

InVentia telemetry modules were used for data transfer between the objects and the monitoring system control station. These modules implement cyclic and event transmission (send data when a predefined event occurs). They also respond to queries from the control room.

SMS messages are sent from each pump station when one of the predefined alarms occurs. One alarm can generate SMS to a maximum of five operators. It is up to the control room to decide how many and to which operators such SMS will be sent.

The trend system consists of a chart and a dialog window that allows selection of parameters to be displayed in the chart. Each trend is plotted in a different default color, which can be changed as needed.
A reporting system showing the status of a pump station for a certain period of time (e.g.: one day) consists of a graph showing: wastewater level, flow, confirmation of operation and failure of pump P1, flow, confirmation of operation and failure of pump P2, as well as power failure, hydrostatic probe failure, dry run and overflow. The report contains the number of occurrences of the mentioned alarms at the selected time.
See also:
Navigation:
- Complete control and monitoring system ID-6.2 - airports Magnitogorsk (Russia) and Bautzen (Germany)
- HVAC, regulation of energy consumption, lighting control - Univerzita J. E. Purkyně, Ústí n. Labem
- Monitoring of sewerage network - WOZ Goleniów